


Chproxy与ClickHouse监控安装
Chrpoxy
Chrpoxy是ClickHouse的代理服务器,具有分用户路由和响应缓存等特征。
1.安装
直接下载编译好的二进制文件,解压后就可以用
2.编写配置文件
log_debug: false

hack_me_please: true

# 缓存配置
caches:
  - name: "longterm"
    mode: "file_system"
    file_system:
      max_size: 100Gb
      dir: "/data/software/chproxy/data/cachedir"
    expire: 1h
    grace_time: 20s

# 监听端口
server:
  http:
    listen_addr: ":10240"
    read_timeout: 5m
    write_timeout: 10m
    idle_timeout: 20m

  # 提供给prometheus
  metrics:

# Chproxy的用户信息[非ck集群用户]
users:
  - name: "wxpt_user"
    password: "abc123456"
    # 路由到指定CK集群
    to_cluster: "wxpt_cluster"
    # 路由到指定CK集群用户
    to_user: "unicom_query"
    deny_http: false
    allow_cors: true
    cache: "longterm"
    max_queue_size: 1000
    max_concurrent_queries: 500
    max_execution_time: 10m
    max_queue_time: 10m

clusters:
  # CK集群
  - name: "wxpt_cluster"
    scheme: "http"
    nodes: [ "wxpt-ck-01:8123","wxpt-ck-02:8123","wxpt-ck-03:8123","wxpt-ck-04:8123","wxpt-ck-05:8123","wxpt-ck-01:18123","wxpt-ck-02:18123","wxpt-ck-03:18123","wxpt-ck-04:18123","wxpt-ck-05:18123" ]
    heartbeat_interval: 1m
  # 管理员用户
    kill_query_user:
      name: "default"
      password: "abc123456"
  # CK集群用户
    users:
      - name: "unicom_query"
        password: "abc123456"
        max_concurrent_queries: 500
        max_execution_time: 30m

      - name: "default"
        password: "abc123456"
        max_concurrent_queries: 500
        max_execution_time: 30m
3.管理脚本
重启脚本
#!/bin/bash

ps -ef | grep '/data/software/chproxy/chproxy' | grep -v grep | head -2 | tail -1 | awk '{print $2}' | xargs kill -9

nohup /data/software/chproxy/chproxy -config=/data/software/chproxy/config/wxpt.yml >> /data/software/chproxy/logs/chproxy.out 2>&1 &
停止脚本
#!/bin/bash

ps -ef | grep '/data/software/chproxy/chproxy' | head -2 | tail -1 | awk '{print $2}' | xargs kill -9
4.测试
直接执行命令
echo "select 1;" | curl 'http://10.172.134.200:10240/?user=wxpt_user&password=abc123456' --data-binary @-
使用DBeaver连接
ClickHouse监控
监控主要使用 Prometheus + Grafana 实现
Prometheus
1.安装
下载并解压
2.配置
编辑配置文件
vim ./prometheus.yml
global:
  scrape_interval: 15s # Set the scrape interval to every 15 seconds. Default is every 1 minute.
  evaluation_interval: 15s # Evaluate rules every 15 seconds. The default is every 1 minute.

scrape_configs:
  # CK集群
  - job_name: "wxpt-ck-prometheus"
    static_configs:
      - targets: ["wxpt-ck-01:9363","wxpt-ck-01:19363","wxpt-ck-02:9363","wxpt-ck-02:19363","wxpt-ck-03:9363","wxpt-ck-03:19363","wxpt-ck-04:9363","wxpt-ck-04:19363","wxpt-ck-05:9363","wxpt-ck-05:19363"]

  # Chproxy
  - job_name: "wxpt-chproxy"
    static_configs:
      - targets: ["wxpt-ck-01:10240"]
PS:CK集群监控需在CK集群配置文件中开启
vim ./config.xml
    <prometheus>
        <endpoint>/metrics</endpoint>
        <port>9363</port>

        <metrics>true</metrics>
        <events>true</events>
        <asynchronous_metrics>true</asynchronous_metrics>
        <status_info>true</status_info>
    </prometheus>
3.启停脚本
启动
#!/bin/bash

PATH="/data/software/prometheus/prometheus-2.38.0.linux-amd64"
LOG_PATH="${PATH}/logs"

$PATH/prometheus --log.level=info --web.enable-lifecycle --web.enable-admin-api --query.max-concurrency=20 --query.timeout=2m --storage.tsdb.path=$PATH/data --storage.tsdb.retention.time=180d --config.file=$PATH/prometheus.yml --web.listen-address=:9090 >> $LOG_PATH/prometheus.log  2>&1 &
停止
curl -X POST http://wxpt-ck-01:9090/-/quit
重载配置文件
curl -XPOST http://wxpt-ck-01:9090/-/reload
4.进入配置页面
浏览器输入http://wxpt-ck-01:9090/targets?search=
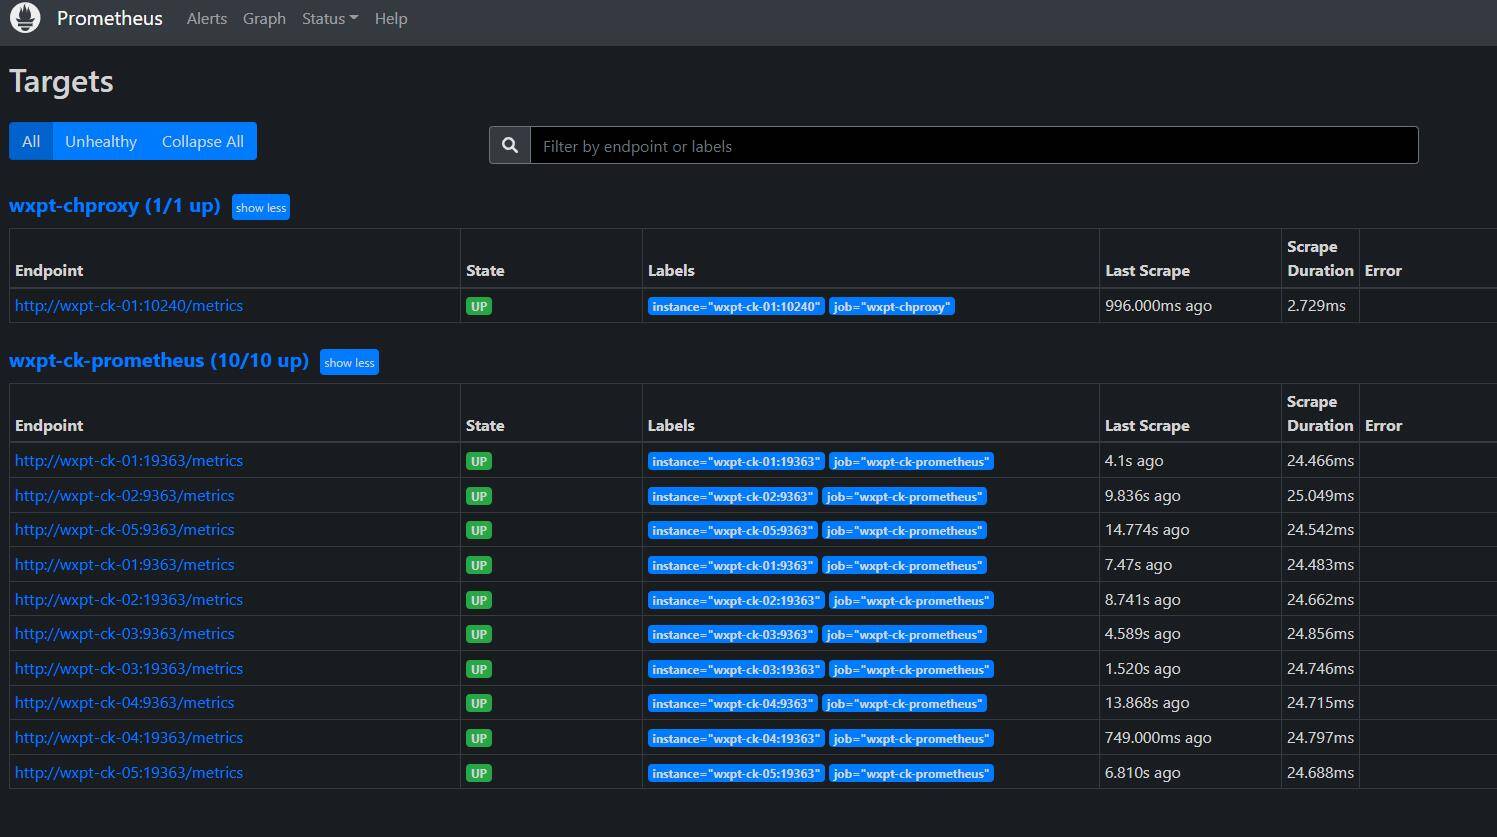
出现该页面即为配置成功
Grafana
1.安装
直接下载RPM包
安装
2.启动
service grafana-server start
3.配置
浏览器输入 http://wxpt-ck-01:13000
添加数据源
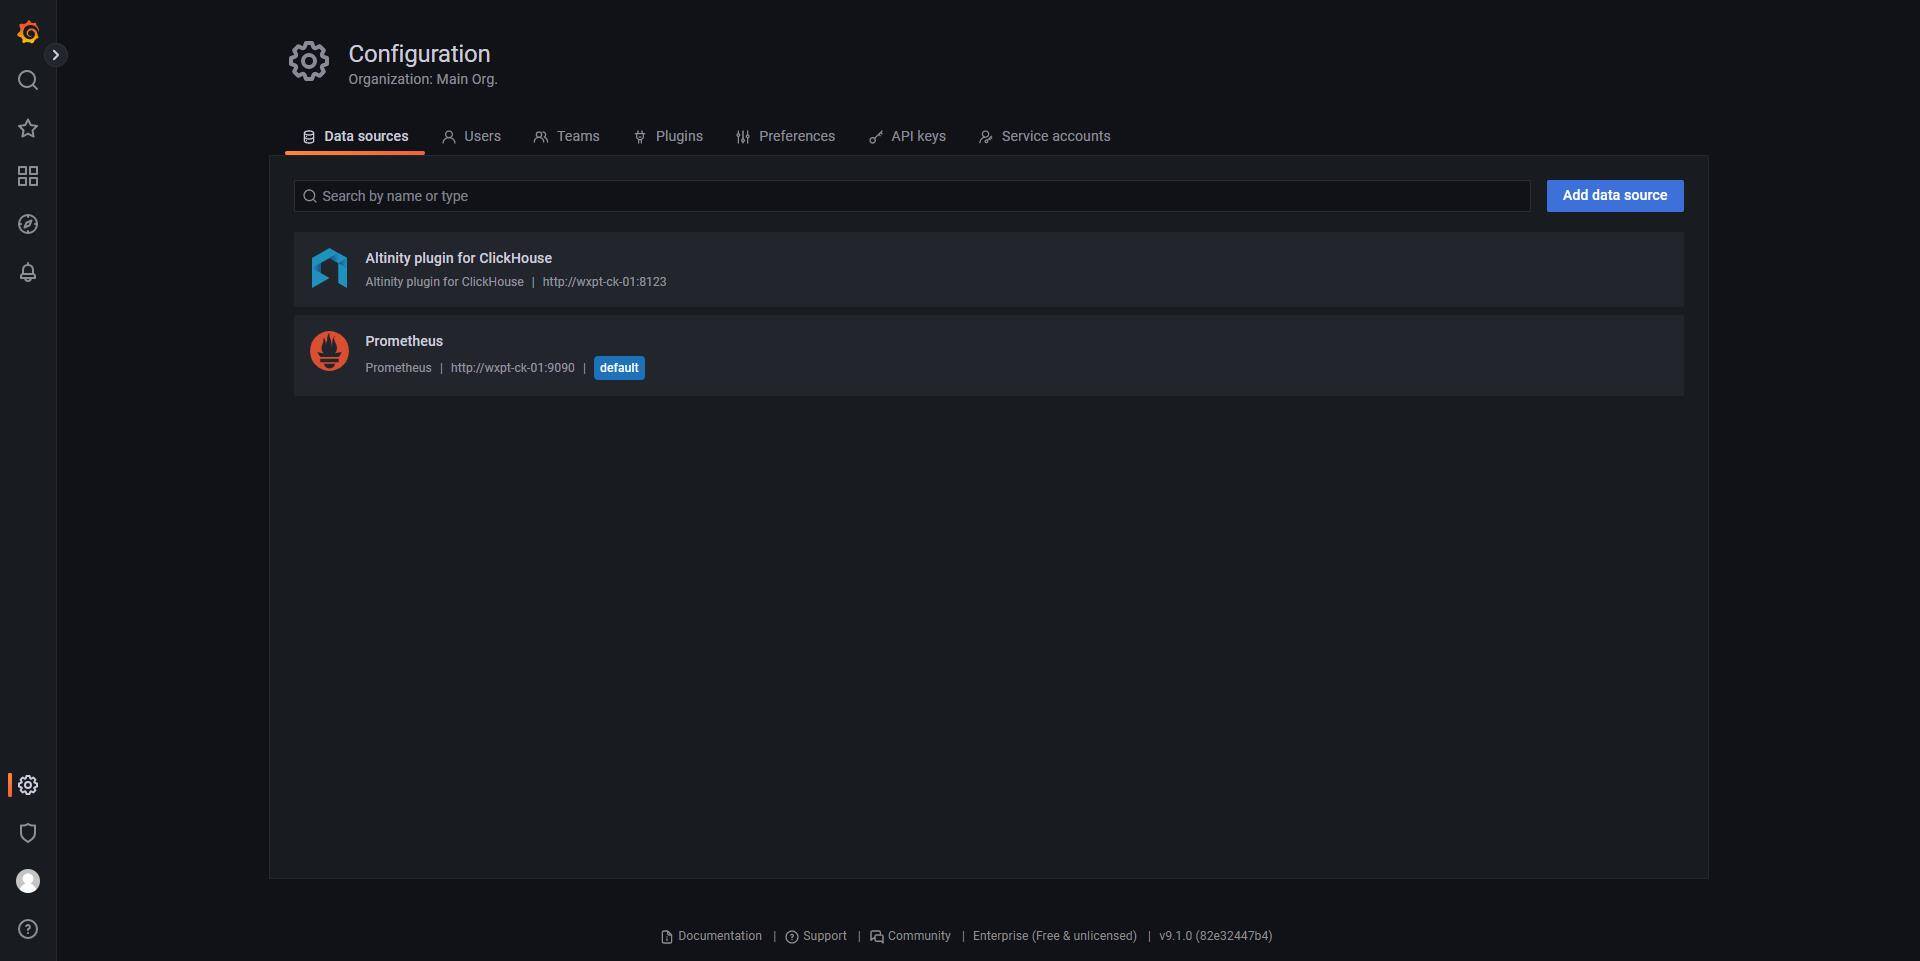
选择Prometheus
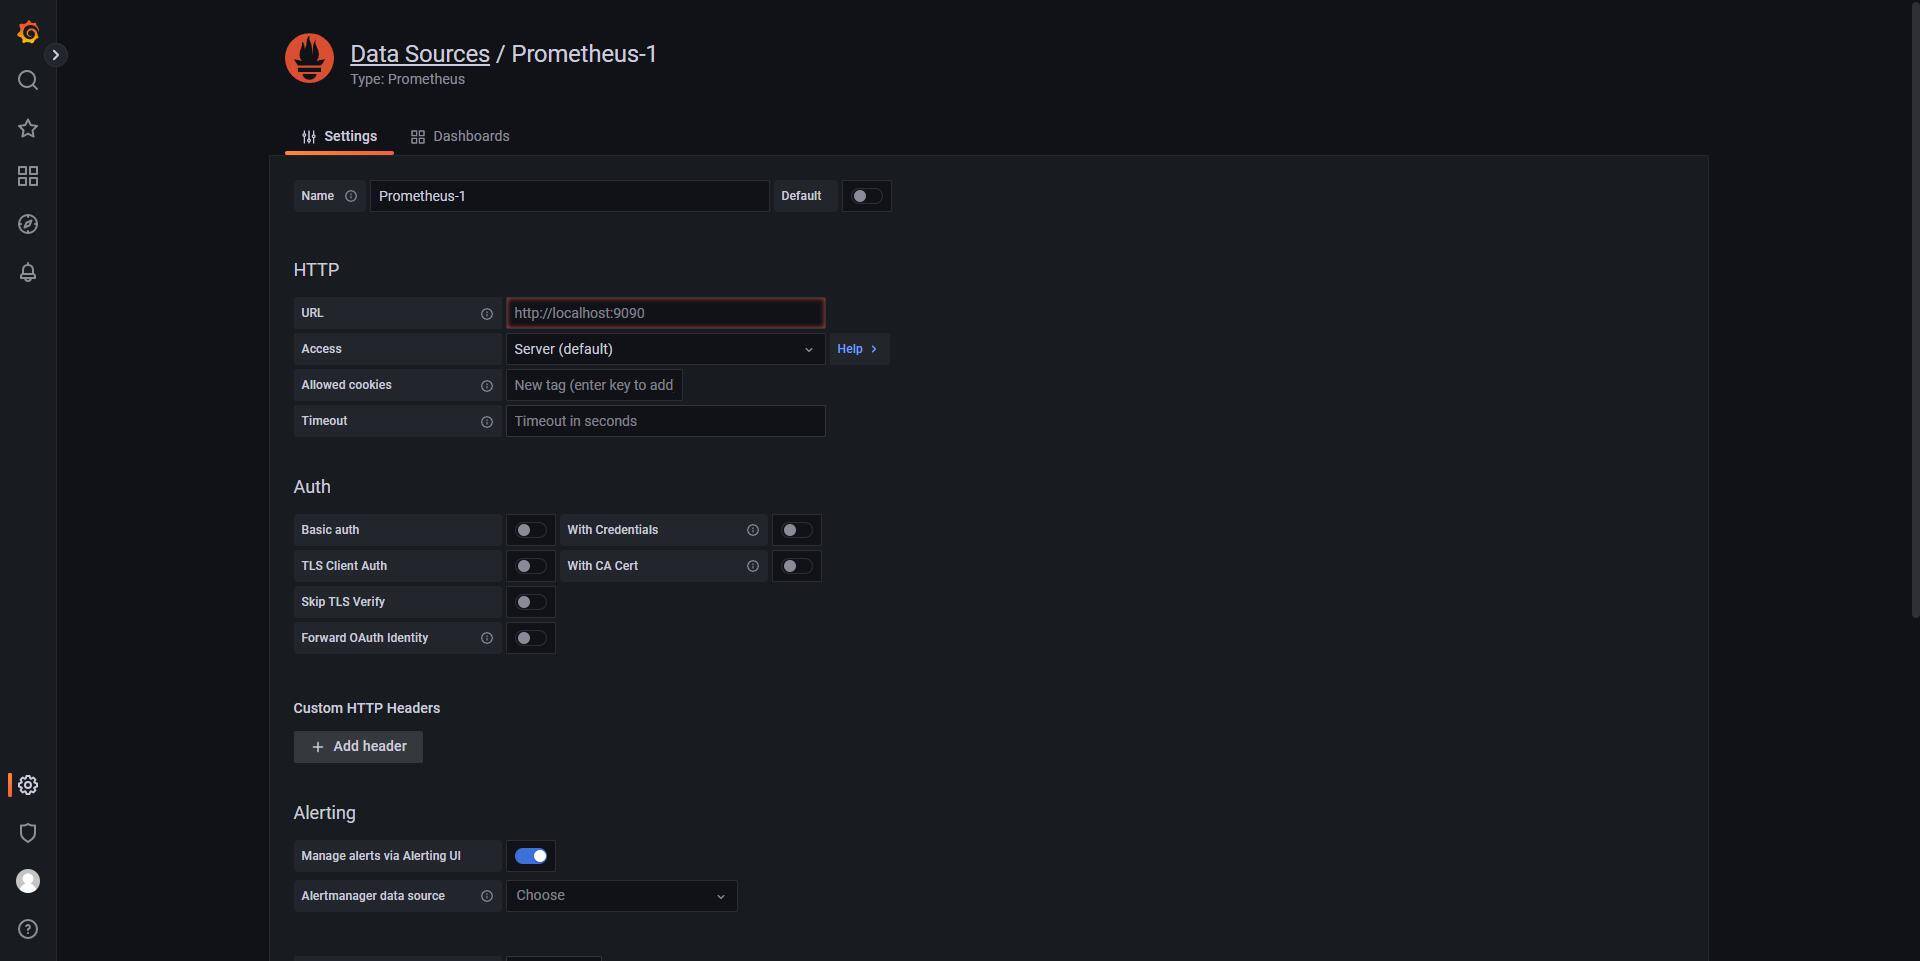
填入URL与用户名密码点击保存
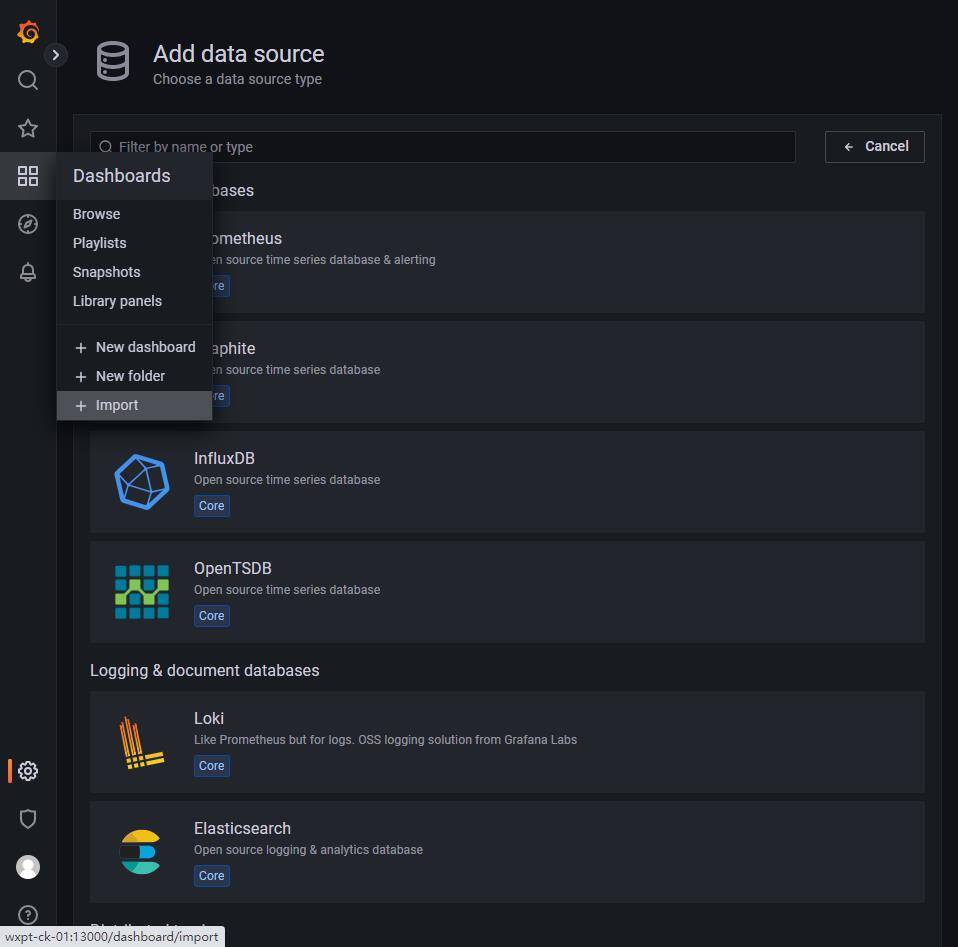
手动输入JSON配置,或者在官网下载JSON文件上传

选择对应数据源保存即可
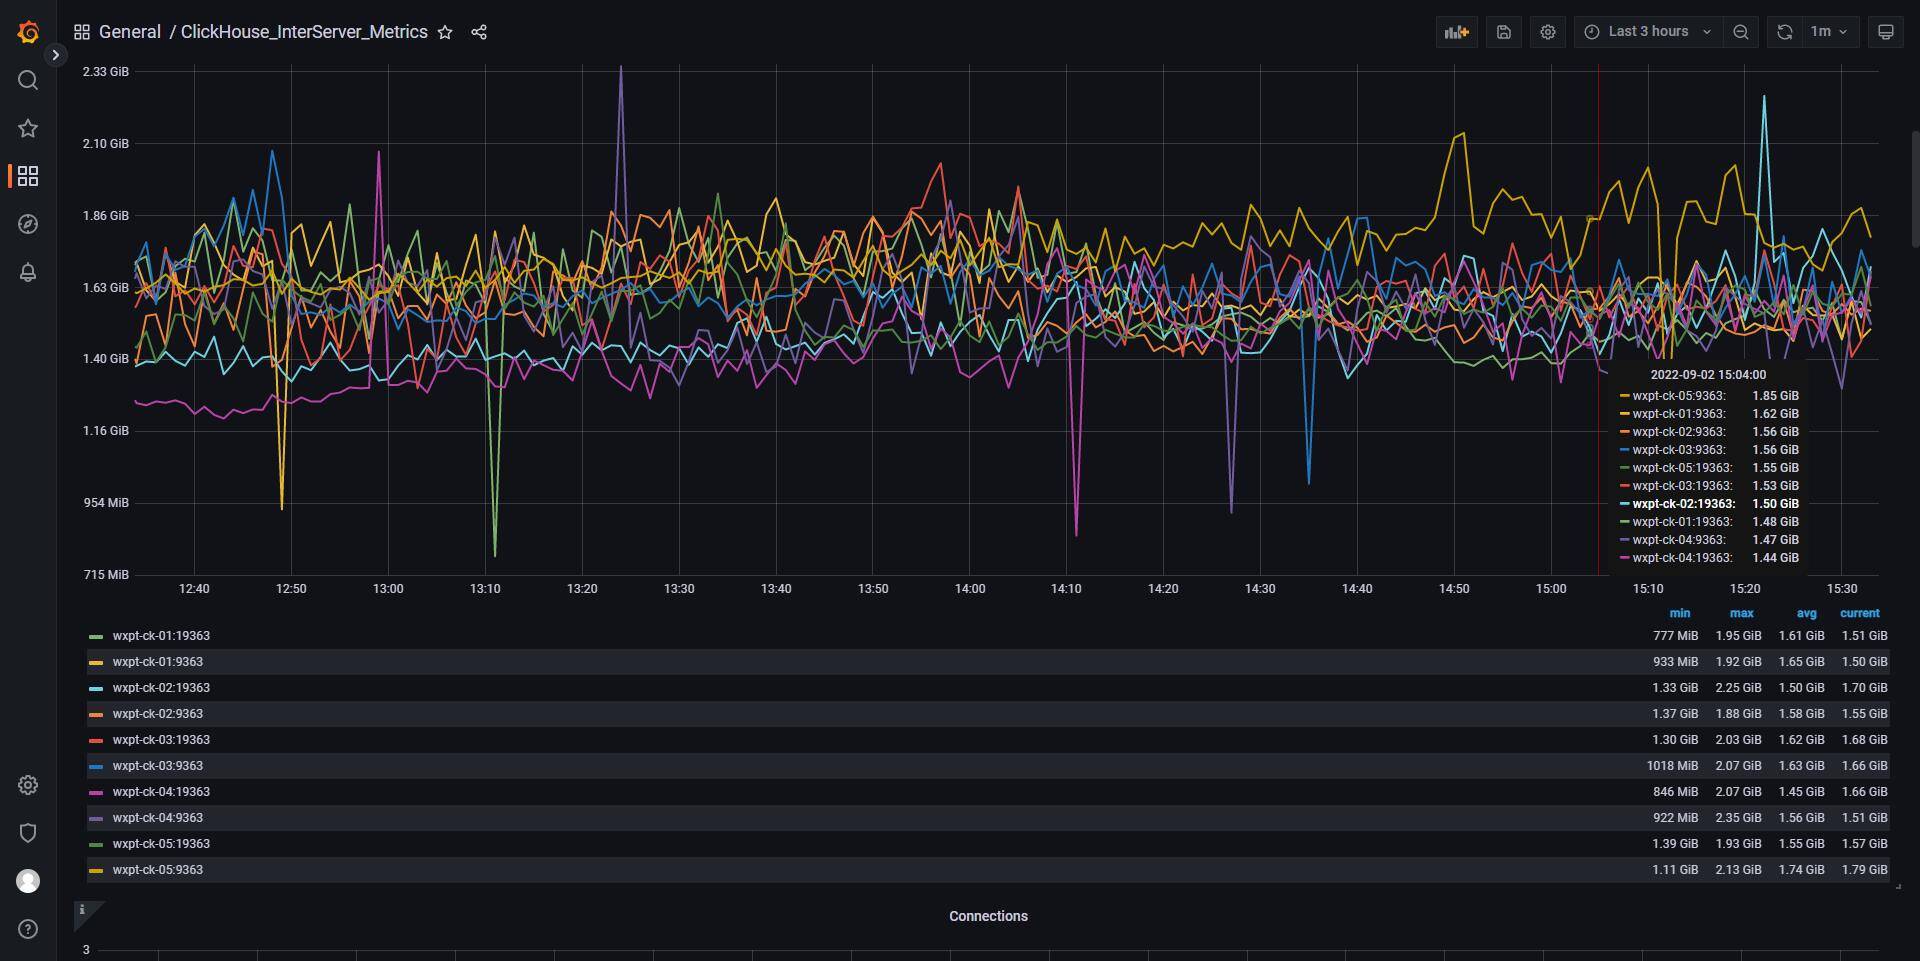
4.查看
进入看板页面,并选择已添加的看板即可
Comments | NOTHING